Dharani Suresh
Tracking Vegetation Dynamics in Wisconsin Through NDVI Analysis, 2018-2023
Introduction:
Nestled in the Midwest, Wisconsin boasts a rich tapestry of forests, farmlands, and urban landscapes, offering a vibrant tableau for environmental observation. This study uncovers interesting trends by leveraging high-resolution Terra MODIS satellite data to chart the evolution of vegetation in Wisconsin from 2018 to 2023. By employing the Normalized Difference Vegetation Index (NDVI), this study illuminates the growth and vitality of green spaces within the state amid fluctuating environmental conditions. This research compares NDVI metrics from within the boundaries of Wisconsin to those beyond, revealing an intriguing pattern of environmental adaptation and recovery. As we traverse through shades of green, this study sheds light on the enduring resilience of Wisconsin’s natural environments, suggesting a hopeful outlook for ecological health and sustainability.
# Install the development version of the earthpy package
!pip install git+https://github.com/earthlab/earthpy@apppears
import getpass
import json
import os
import pathlib
from glob import glob
import pandas as pd
import geopandas as gpd
import earthpy.appeears as eaapp
import hvplot.pandas
import hvplot.xarray
import rioxarray as rxr
import xarray as xr
data_dir = os.path.join(pathlib.Path.home(), 'wi-ndvi-data')
# Make the data directory
os.makedirs(data_dir, exist_ok=True)

data_dir
# Download the WI state boundary
wi_url = ("https://dnrmaps.wi.gov/arcgis/rest/services/DW_Map_Dynamic/EN_Basic_Basemap_WTM_Ext_Dynamic_L16/MapServer/6/query?where=1%3D1&outFields=*&outSR=4326&f=json")
wi_url
wi_gdf = gpd.read_file(
 wi_url, index_col='DATE', parse_dates=True, na_values='NaN')
wi_gdf
# Plot the WI state boundary
wi_gdf.hvplot(
    title='Wisconsin State Boundary',
    tiles='EsriImagery')
Note: This plot defines the geographical extent of Wisconsin, outlined clearly against the surrounding regions. The boundary plot is essential for understanding the spatial context of the NDVI data and ensuring that analyses are correctly confined to the state.

# Initialize AppeearsDownloader for MODIS NDVI data
ndvi_downloader = eaapp.AppeearsDownloader(
    download_key='wi-ndvi',
    ea_dir=data_dir,
    product='MOD13Q1.061',
    layer='_250m_16_days_NDVI',
    start_date="07-01",
    end_date="07-31",
    recurring=True,
    year_range=[2018, 2023],
    polygon=wi_gdf
)
ndvi_downloader.download_files(cache=True)
# Get list of NDVI tif file paths
ndvi_paths = sorted(glob(os.path.join(data_dir, 'wi-ndvi', '*', '*NDVI*.tif')))
len(ndvi_paths)
30 files
scale_factor = 10000
doy_start = -19
doy_end = -12
ndvi_das = []
for ndvi_path in ndvi_paths:
    # Get date from file name
    doy = ndvi_path[doy_start:doy_end]
    date = pd.to_datetime(doy, format='%Y%j')

    # Open dataset
    da = rxr.open_rasterio(ndvi_path, masked=True).squeeze()

    # Add date dimension and clean up metadata
    da = da.assign_coords({'date': date})
    da = da.expand_dims({'date': 1})
    da.name = 'NDVI'

    # Multiple by scale factor
    da = da / scale_factor

    # Prepare for concatenation
    ndvi_das.append(da)

len(ndvi_das)
ndvi_da = xr.combine_by_coords(ndvi_das, coords=['date'])
ndvi_da
ndvi_diff = (
    ndvi_da
        .sel(date=slice('2021', '2023'))
        .mean('date')
        .NDVI
   - ndvi_da
        .sel(date=slice('2018', '2020'))
        .mean('date')
        .NDVI
)
(
    ndvi_diff.hvplot(x='x', y='y', cmap='PiYG', geo=True)
    *
    wi_gdf.hvplot(geo=True, fill_color=None, line_color='black')
)
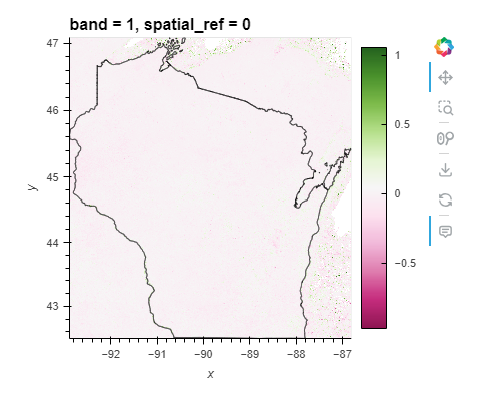
Note: The spatial distribution of NDVI differences within the state boundary shows significant variability. The eastern and some northern parts of Wisconsin exhibit higher NDVI values (green shades), possibly due to better vegetation health or different types of land cover like forests and wetlands. The areas showing negative values (pink shades) could indicate urban areas, water bodies, or regions with less vegetation.
out_gdf = (
    gpd.GeoDataFrame(geometry=wi_gdf.envelope)
    .overlay(wi_gdf, how='difference'))
# Clip data to both inside and outside the boundary
ndvi_cp_da = ndvi_da.rio.clip(wi_gdf.geometry, from_disk=True)
ndvi_out_da = ndvi_da.rio.clip(out_gdf.geometry, from_disk=True)
# Compute mean annual July NDVI
jul_ndvi_cp_df = (
    ndvi_cp_da
    .groupby(ndvi_cp_da.date.dt.year)
    .mean(...)
    .NDVI.to_dataframe())
jul_ndvi_out_df = (
    ndvi_out_da
    .groupby(ndvi_out_da.date.dt.year)
    .mean(...)
    .NDVI.to_dataframe())

# Plot inside and outside
jul_ndvi_df = (
    jul_ndvi_cp_df[['NDVI']]
    .join(
        jul_ndvi_out_df[['NDVI']],
        lsuffix=' Inside WI Boundary', rsuffix=' Outside WI Boundary')
)

jul_ndvi_df.hvplot(
    title='NDVI of WI from 2018 to 2020 and from 2021 to 2023'
)
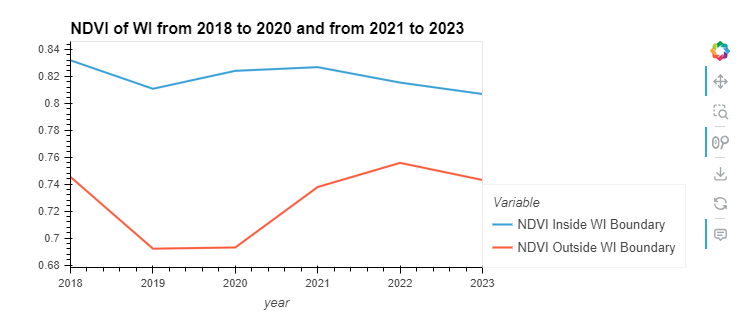
Obervation: The NDVI (Normalized Difference Vegetation Index) trends for areas inside and outside Wisconsin’s boundaries show distinct patterns. The NDVI inside Wisconsin remains relatively stable and high (above 0.74) throughout the period, indicating healthy vegetation cover. In contrast, the NDVI outside Wisconsin shows significant fluctuation and a general decline, especially noticeable from 2020 to 2022, suggesting changes in vegetation health or land use outside the state.
# Plot difference inside and outside
jul_ndvi_df['difference'] = (
    jul_ndvi_df['NDVI Inside WI Boundary']
    - jul_ndvi_df['NDVI Outside WI Boundary'])
jul_ndvi_df.difference.hvplot(
    title='Difference between NDVI of WI from 2018 to 2020 and from 2021 to 2023'
)
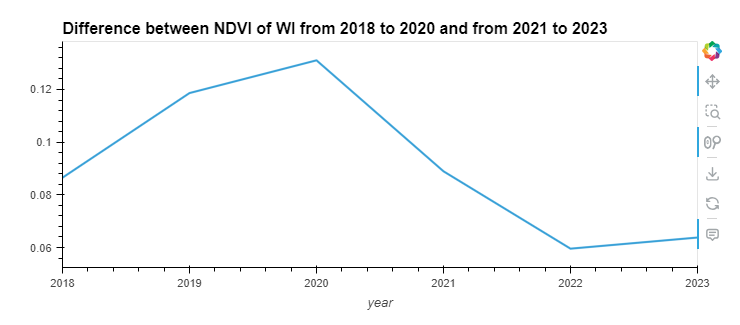
Observation: This plot highlights the difference in NDVI between the inside and outside of Wisconsin over the years. The peak difference occurs around 2019 and early 2020, after which there’s a notable decline. By 2023, the difference decreases significantly, suggesting a narrowing gap in vegetation health between the areas inside and outside Wisconsin. This could be due to environmental policies, changes in land usage, or climatic conditions affecting vegetation differently in these areas.
%%capture
%%bash
jupyter nbconvert "wi_ndvi_short_ver.ipynb" --to markdown